No place in the United States is completely immune from natural disasters.
Every state faces unique environmental challenges — from hurricanes and tornadoes to earthquakes, flooding, winter storms, wildfires, drought, and extreme heat. Understanding those risks doesn't eliminate them, but it does allow individuals, families, and communities to prepare more effectively.
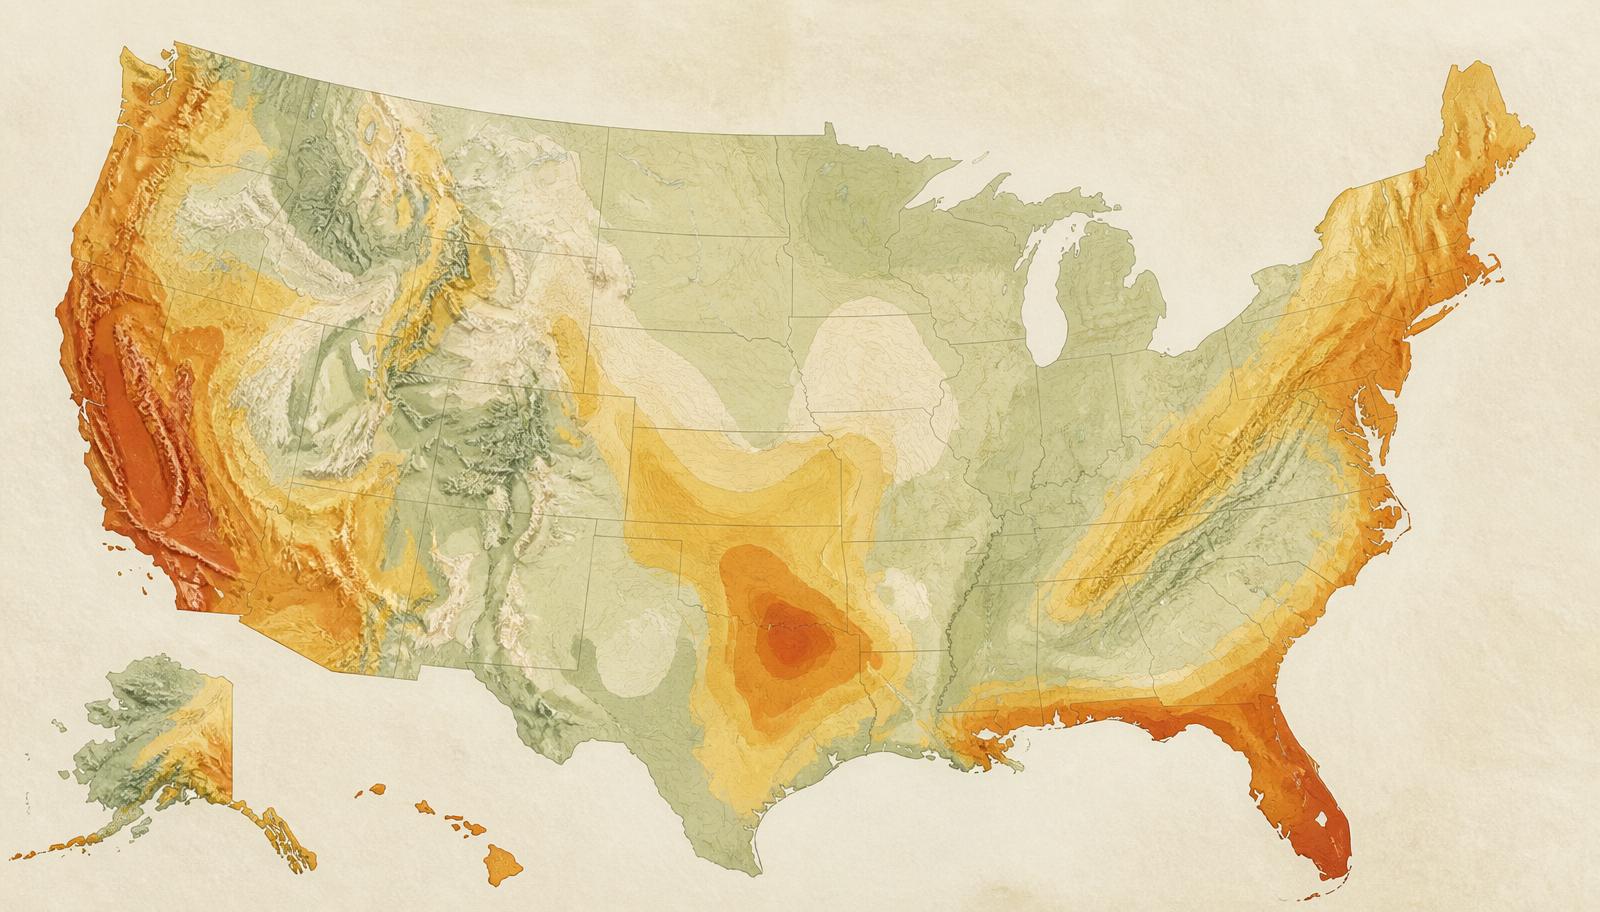
This analysis ranks all 50 states using FEMA's National Risk Index — a composite score that combines historical event frequency, exposure of buildings, population, and agriculture, and community vulnerability across 18 hazard types.
Methodology
Rankings on this page use FEMA's Expected Annual Loss (EAL) score — a 0–100 index representing the average yearly cost of natural hazards in a state, normalized to national percentile. Lower scores mean lower exposure. The "primary" and "secondary" hazards for each state are the two individual hazards contributing the most to that state's EAL.
Weighted Hazard Categories
FEMA's index folds 18 distinct hazards into one score. These are the eight that drive the most variation between states.
Interactive United States Map
Click any state to see its EAL score, FEMA rating, and top two hazards.
Top 10 Lowest-Risk States
Ranked from lowest to highest overall EAL score.
Top 10 Highest-Risk States
Ranked from highest to lowest overall EAL score. High risk isn't a verdict — it's a preparedness signal.
Complete Rankings
| Rank | State | Score | FEMA Rating | Primary | Secondary | Region |
|---|---|---|---|---|---|---|
| 1 | Rhode Island | 7.1 | Very Low | Hurricane | Coastal Flooding | Northeast |
| 2 | Vermont | 8.9 | Very Low | Landslide | Avalanche | Northeast |
| 3 | District of Columbia | 10.7 | Very Low | Hurricane | Earthquake | Northeast |
| 4 | Wyoming | 14.3 | Very Low | Avalanche | Landslide | Mountain West |
| 5 | Delaware | 16.1 | Very Low | Coastal Flooding | Hurricane | Northeast |
| 6 | Maine | 17.9 | Very Low | Ice Storm | Winter Weather | Northeast |
| 7 | New Hampshire | 19.6 | Very Low | Avalanche | Hurricane | Northeast |
| 8 | North Dakota | 21.4 | Very Low | Winter Weather | Hail | Midwest |
| 9 | Idaho | 23.2 | Relatively Low | Wildfire | Landslide | Mountain West |
| 10 | Montana | 25.0 | Relatively Low | Avalanche | Landslide | Mountain West |
| 11 | South Dakota | 26.8 | Relatively Low | Winter Weather | Drought | Midwest |
| 12 | Alaska | 28.6 | Relatively Low | Avalanche | Landslide | Alaska |
| 13 | New Mexico | 30.4 | Relatively Low | Wildfire | Drought | Mountain West |
| 14 | West Virginia | 32.1 | Relatively Low | Landslide | Inland Flooding | South |
| 15 | Maryland | 33.9 | Relatively Low | Heat Wave | Winter Weather | Northeast |
| 16 | Hawaii | 35.7 | Relatively Low | Volcanic Activity | Landslide | Hawaii |
| 17 | Connecticut | 37.5 | Relatively Low | Coastal Flooding | Hurricane | Northeast |
| 18 | Nebraska | 39.3 | Relatively Low | Hail | Drought | Midwest |
| 19 | Nevada | 41.1 | Relatively Low | Wildfire | Heat Wave | Mountain West |
| 20 | Massachusetts | 42.9 | Relatively Low | Coastal Flooding | Hurricane | Northeast |
| 21 | Utah | 44.6 | Relatively Low | Earthquake | Wildfire | Mountain West |
| 22 | Mississippi | 46.4 | Relatively Low | Hurricane | Drought | South |
| 23 | Arkansas | 48.2 | Relatively Low | Ice Storm | Earthquake | South |
| 24 | Kansas | 50.0 | Relatively Low | Hail | Winter Weather | Midwest |
| 25 | Iowa | 51.8 | Relatively Low | Drought | Hail | Midwest |
| 26 | Virginia | 53.6 | Relatively Low | Drought | Hurricane | South |
| 27 | Colorado | 55.4 | Relatively Moderate | Hail | Lightning | Mountain West |
| 28 | Oklahoma | 57.1 | Relatively Moderate | Ice Storm | Drought | South |
| 29 | Kentucky | 58.9 | Relatively Moderate | Ice Storm | Strong Wind | South |
| 30 | Indiana | 60.7 | Relatively Moderate | Tornado | Strong Wind | Midwest |
| 31 | Alabama | 62.5 | Relatively Moderate | Tornado | Lightning | South |
| 32 | Oregon | 64.3 | Relatively Moderate | Earthquake | Wildfire | Pacific Coast |
| 33 | Minnesota | 66.1 | Relatively Moderate | Cold Wave | Strong Wind | Midwest |
| 34 | Wisconsin | 67.9 | Relatively Moderate | Cold Wave | Hail | Midwest |
| 35 | Michigan | 69.6 | Relatively Moderate | Strong Wind | Tornado | Midwest |
| 36 | South Carolina | 71.4 | Relatively Moderate | Hurricane | Ice Storm | South |
| 37 | Tennessee | 73.2 | Relatively Moderate | Cold Wave | Earthquake | South |
| 38 | Ohio | 75.0 | Relatively Moderate | Ice Storm | Lightning | Midwest |
| 39 | New Jersey | 78.6 | Relatively Moderate | Strong Wind | Coastal Flooding | Northeast |
| 40 | Georgia | 80.4 | Relatively Moderate | Lightning | Tornado | South |
| 41 | Louisiana | 82.1 | Relatively Moderate | Hurricane | Coastal Flooding | South |
| 42 | Arizona | 83.9 | Relatively Moderate | Heat Wave | Wildfire | Mountain West |
| 43 | Missouri | 85.7 | Relatively Moderate | Heat Wave | Ice Storm | Midwest |
| 44 | Pennsylvania | 87.5 | Relatively Moderate | Winter Weather | Heat Wave | Northeast |
| 45 | New York | 89.3 | Relatively Moderate | Inland Flooding | Coastal Flooding | Northeast |
| 46 | North Carolina | 91.1 | Relatively Moderate | Winter Weather | Hurricane | South |
| 47 | Washington | 92.9 | Relatively Moderate | Earthquake | Landslide | Pacific Coast |
| 48 | Illinois | 94.6 | Relatively High | Cold Wave | Tornado | Midwest |
| 49 | Florida | 96.4 | Relatively High | Coastal Flooding | Hurricane | South |
| 50 | Texas | 98.2 | Relatively High | Hail | Tornado | South |
| 51 | California | 100.0 | Very High | Drought | Earthquake | Pacific Coast |
Recent Notable Events
A sample of impactful 2025–2026 events pulled from NOAA's Storm Events Database and NIFC wildfire reports.
- AKEarthquake· M4.3 · 72 km SE of Atka, AlaskaJul 26, 2026 · USGS—
- AKEarthquake· M5.8 · 99 km SE of Atka, AlaskaJul 26, 2026 · USGS—
- AKEarthquake· M4.1 · 80 km SE of Atka, AlaskaJul 26, 2026 · USGS—
- AKEarthquake· M4.0 · 136 km SSE of Atka, AlaskaJul 25, 2026 · USGS—
- AKEarthquake· M5.0 · 91 km SE of Atka, AlaskaJul 25, 2026 · USGS—
- AKEarthquake· M4.2 · 227 km ESE of Attu Station, AlaskaJul 24, 2026 · USGS—
- PREarthquake· M4.8 · 54 km NNW of San Antonio, Puerto RicoJul 24, 2026 · USGS—
- AKEarthquake· M5.0 · 94 km SSE of Adak, AlaskaJul 24, 2026 · USGS—
- ORWildfire· Big GrassJul 23, 2026 · NIFC IMSR—
- OREarthquake· M4.2 · 150 km WNW of Port Orford, OregonJul 23, 2026 · USGS—
- TXEarthquake· M5.0 · 38 km SSE of Spearman, TexasJul 23, 2026 · USGS—
- AKEarthquake· M5.1 · 92 km SE of Atka, AlaskaJul 23, 2026 · USGS—
- AKEarthquake· M4.6 · 95 km SE of Atka, AlaskaJul 23, 2026 · USGS—
- AKEarthquake· M4.9 · 96 km SSE of Akhiok, AlaskaJul 22, 2026 · USGS—
- ORWildfire· Cow Camp ComplexJul 21, 2026 · NIFC IMSR—
- OREarthquake· M4.6 · 214 km W of Bandon, OregonJul 21, 2026 · USGS—
- CAWildfire· RockJul 20, 2026 · NIFC IMSR—
- AKEarthquake· M4.0 · 72 km SSW of Atka, AlaskaJul 20, 2026 · USGS—
- AKEarthquake· M4.0 · 27 km SE of Adak, AlaskaJul 19, 2026 · USGS—
- AKEarthquake· M4.1 · 235 km ESE of Attu Station, AlaskaJul 19, 2026 · USGS—
- CAWildfire· BiscarJul 18, 2026 · NIFC IMSR—
- AKEarthquake· M4.0 · 102 km SSE of Akhiok, AlaskaJul 18, 2026 · USGS—
- AKEarthquake· M4.3 · 104 km SSE of Akhiok, AlaskaJul 18, 2026 · USGS—
- ORWildfire· 0512 Box SpringsJul 17, 2026 · NIFC IMSR—
- WAWildfire· ModriteJul 17, 2026 · NIFC IMSR—
- ORWildfire· Hay Creek ComplexJul 17, 2026 · NIFC IMSR—
- ORWildfire· Powder RiverJul 17, 2026 · NIFC IMSR—
- FLWildfire· Berger 50Jul 17, 2026 · NIFC IMSR—
- AKEarthquake· M4.2 · 212 km ESE of Attu Station, AlaskaJul 17, 2026 · USGS—
- WAWildfire· Neff JonesJul 16, 2026 · NIFC IMSR—
Regional Breakdown
Most Common U.S. Hazards
Where: River basins, coastal plains, and flash-flood-prone canyons nationwide.
Season: Spring snowmelt, summer thunderstorms, tropical systems.
Tip: Know your flood zone. One inch of water can cause $25k+ in damage.
Where: Western U.S., but increasingly the Southeast and Great Plains.
Season: Late summer through fall in most regions.
Tip: Maintain defensible space and pre-plan two evacuation routes.
Where: West Coast, Alaska, and the New Madrid seismic zone.
Season: Year-round; no seasonal pattern.
Tip: Secure heavy furniture and water heaters; keep shoes near the bed.
Where: Great Plains, Deep South, Ohio and Tennessee valleys.
Season: Peak April–June, with a secondary fall spike in the South.
Tip: Interior room, lowest floor, NOAA radio with battery backup.
Where: Atlantic and Gulf coasts from Texas to Maine.
Season: June 1 – November 30, peak mid-August through October.
Tip: Know your evacuation zone before a storm is named.
Where: Desert Southwest, Southeast, and increasingly the Pacific Northwest.
Season: Late June through August.
Tip: Plan for grid stress; a single cool room and hydration plan save lives.
Where: Northeast, Upper Midwest, Mountain West, and Alaska.
Season: November through March.
Tip: Heat redundancy, carbon monoxide detectors, and 72 hours of water.
Where: Western U.S., Southern Plains, and parts of the Southeast.
Season: Multi-year cycles rather than a single season.
Tip: Stored water and awareness of local well and reservoir conditions.
What This Means for Homeowners
- Insurance. Review flood and wildfire policies annually; standard homeowners policies exclude both.
- Backup power. A whole-home generator or a portable power station covers most outage scenarios.
- Home hardening. Impact windows, roof strapping, and defensible space measurably reduce loss.
- Emergency water. Store at least one gallon per person per day for 72 hours; more in arid regions.
- Evacuation. Know two routes out of your neighborhood and one destination beyond your county.
- Fire protection. Smoke and CO detectors on every level, an extinguisher in the kitchen and garage.
What This Means for Renters
- Apartment preparedness. Identify the safest interior room and how to shut off water and gas.
- Renter's insurance. Confirm coverage for wind, fire, and personal belongings — flood is usually separate.
- Emergency kits. A single duffel with 72 hours of supplies works better than a scattered pantry.
- Communication plans. An out-of-state contact and a written meet-up point matter when cell towers fail.
- Portable power. A small battery station keeps phones, medical devices, and a fan running for days.
Common Misconceptions
Even the lowest-risk states experience winter storms, flooding, or severe weather. "Safe" is relative.
Northern states face blizzards, ice storms, and cold-weather power failures that can be just as deadly as heat.
The Southeast, Great Plains, and parts of the Northeast all see meaningful wildfire activity in dry years.
Severe convective storms, drought, and inland flooding drive a growing share of federal disaster costs.
A prepared household in a high-risk state often fares better than an unprepared one in a low-risk state.
"Preparedness isn't about finding the perfect place to live. It's about understanding the hazards where you live and planning accordingly."
Final Thoughts
Natural disasters can't be eliminated, but their impact can often be reduced through preparation. No ranking should replace local knowledge, emergency planning, or common sense. Understanding your state's hazards is the first step toward building resilience.
About Our Data
Weekly preparedness research, data-driven analysis, and practical field guides — without fearmongering.